National Association of States United for Aging and Disabilities
NASUAD posts a chart that translates both the President's proposed budget and expected funding in terms of programs that serve senior citizens. Transportation is included, but the list is vast. NASUAD also released a state-of-the-state report that reviews state aging services. This is one of those reports with fascinating and informative tables for anyone interested in what states pay for which services and what is covered by Medicaid in different states.
AARP
Related to the reports described above is one that AARP prepared with NASUAD staff. On the Verge: The Transformation of Long-Term Services and Supports discusses state budgets, staffing and policy trends. Notable is a discussion of the uncertainty of the Affordable Care Act.
Paralyzed Veterans of America
PVA and other veterans groups release the annual Independent Budget, a veterans-focused analysis of the President's budget proposals, with advocacy for increased funding in particular areas. There are sections relating to employment, education and medical care. Transportation is discussed in the medical care section.

Thursday, February 16, 2012
Tuesday, February 14, 2012
Associations Educating Members, Urge Members to Contact Congress
Community Transportation Association of America
CTAA has created Reauthorization Central, which contains the different proposed bills in Congress, summaries and CTAA analysis of the legislation, key Congressional committees' documents, Department of Transportation responses and the schedule of possible Congressional actions. Letters to Congress with comments on the funding provisions also are posted, including a joint letter signed on by CTAA, the National League of Cities, the National Association of Counties, the U.S. Conference of Mayors, the National Association of City Transportation Officials, Reconnecting America, and the American Public Transportation Association.
American Public Transportation Association
APTA is strongly opposing the reauthorization proposal in the House.
APTA has also prepared talking points to use when communicating with members of Congress. These include the point that "[t]he Ways and Means proposal to fund public transportation investment with a one-time appropriation would leave transit without any funding source when those funds run out in 2016."
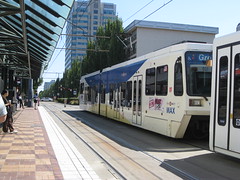
 [Portland light rail near the convention center.]
Planning Organizations at Stake
Association of Metropolitan Planning Organizations
AMPO and APTA are jointly recommending to Congress that the reauthorization retain all exixting metropolitan planning organizations (MPOs), regardless of population size.
National Association of Counties
NACo is concerned about reauthorization proposals that fail to maintain planning organizations.
 [Portland's Amtrak station.]
Amalgamated Transit Union
ATU is advocating in favor of federal operating assistance for transit systems.
Other groups, such as Transportation for America, PolicyLink, and the League of American Bicyclists, among others, are advocating for improved transit funding and multi-modal street networks.
As we go to press, there are House members switching sides to back transit and the Senate is likely to put off a vote.
 [San Luis Obispo Amtrak station.]
Local Stories
Two of the biggest logistical concerns for working parents are transportation and child care. One transit agency is doing both. To attract good employees who can work the nontraditional hours that transit and other industries demand, Prairie Transit in Spearfish, S.D., "opened its own state-licensed child care facility right in its new transit center." The article, Community care: Day care centers draw workers to towns, appeared in the Rapid City Journal.
Indianapolis, Ind. - APTA reports that IndyGo performed well during the Super Bowl festivities. The transit agency had a “Know Before You Go” campaign to alert riders to temporary route changes and offered free rides Feb. 2-5, funded by a federal Congestion Mitigation Air Quality grant.
APTA's news also highlights another story, this from Cincinnati, where the Everybody Rides Metro Foundation, administered by Metro in Cincinnati, provided more than a million free rides in the past four years to low-income workers traveling to and from work, job training, and related activities. "Almost 100 agencies partner with the foundation, including Talbert House, Freestore Foodbank, St. Vincent de Paul, Lighthouse Youth Services, and Cincinnati Works."
Hi-Tech Town
Boston transit riders have hi-tech ways to get real-time information and engage in public participation. The Massachusetts Bay Transportation Authority is texting real-time information to bus riders. Just the stop identification number and the telephone number are all that is needed. And if you have a smartphone, life is even better because Boston boasts more than 40 apps for transit. Helps having lots of smart, techie college students around. The MBTA is also considering service cuts and fare increases. Like the wired town that it is, Boston's residents are commenting publicly - on twitter. That meeting is so last century. Both stories via the TransitWire.
CTAA has created Reauthorization Central, which contains the different proposed bills in Congress, summaries and CTAA analysis of the legislation, key Congressional committees' documents, Department of Transportation responses and the schedule of possible Congressional actions. Letters to Congress with comments on the funding provisions also are posted, including a joint letter signed on by CTAA, the National League of Cities, the National Association of Counties, the U.S. Conference of Mayors, the National Association of City Transportation Officials, Reconnecting America, and the American Public Transportation Association.
American Public Transportation Association
APTA is strongly opposing the reauthorization proposal in the House.
The bill eliminates the Mass Transit Account of the Highway Trust Fund and creates the new Alternative Transportation Account that would provide funding for public transportation, the Congestion Mitigation and Air Quality Control (CMAQ) program, and several other programs. Dedicated funding for the new account has not yet been identified.APTA calls for a predictable and dedicated source of funding. It is supporting a bi-partisan effort in the House to restore transit's funding source. "It is not yet clear if the Rules Committee will allow a vote on this amendment. APTA is urging a full floor vote on this amendment prior to final passage."
APTA has also prepared talking points to use when communicating with members of Congress. These include the point that "[t]he Ways and Means proposal to fund public transportation investment with a one-time appropriation would leave transit without any funding source when those funds run out in 2016."
Planning Organizations at Stake
Association of Metropolitan Planning Organizations
AMPO and APTA are jointly recommending to Congress that the reauthorization retain all exixting metropolitan planning organizations (MPOs), regardless of population size.
Removing the decision-making authority from the local level will reduce the voice of the local government, transit agencies, its citizens, and people in the region. Citizens elect their local public officials to reflect the unique nature of their region, and removing the MPO will only increase the distance between the average citizen and the policy-maker.AMPO and APTA also oppose the 200,000-population threshold for all MPOs as eight states would potentially be left without one unless the Secretary grants approval that they possess the technical capacity to complete the planning requirements. Some that have served as local planning conveners since 1962 would be eliminated.
National Association of Counties
NACo is concerned about reauthorization proposals that fail to maintain planning organizations.
MPOs between 50,000-200,000 would face an uncertain future and are no longer guaranteed a role in the planning process; efforts to enhance the planning role for include rural regions under 50,000 were not successful; the Surface Transportation Program underwent some changes that may not be beneficial to local governments; and funding for the Transportation Enhancement program appears to be no longer mandatory.

Amalgamated Transit Union
ATU is advocating in favor of federal operating assistance for transit systems.
Now more than ever we must urge Members of Congress to do the right thing for our communities by voting yes on the amendment to adopt the original “100 Bus” language which also includes targeted and temporary operating assistance for the nation’s medium size and large transit systems which are also in the midst of a mobility crisis.
Other groups, such as Transportation for America, PolicyLink, and the League of American Bicyclists, among others, are advocating for improved transit funding and multi-modal street networks.
As we go to press, there are House members switching sides to back transit and the Senate is likely to put off a vote.

Local Stories
Two of the biggest logistical concerns for working parents are transportation and child care. One transit agency is doing both. To attract good employees who can work the nontraditional hours that transit and other industries demand, Prairie Transit in Spearfish, S.D., "opened its own state-licensed child care facility right in its new transit center." The article, Community care: Day care centers draw workers to towns, appeared in the Rapid City Journal.
Indianapolis, Ind. - APTA reports that IndyGo performed well during the Super Bowl festivities. The transit agency had a “Know Before You Go” campaign to alert riders to temporary route changes and offered free rides Feb. 2-5, funded by a federal Congestion Mitigation Air Quality grant.
Local fixed route ridership surpassed expectations throughout the entire detour period with a 39 percent increase over average ridership: a total of 325,212 rides over 10 days. IndyGo operated additional buses to accommodate the crowds on fixed route service, reaching a peak of 28 extra buses assisting routes on Feb. 4.
APTA's news also highlights another story, this from Cincinnati, where the Everybody Rides Metro Foundation, administered by Metro in Cincinnati, provided more than a million free rides in the past four years to low-income workers traveling to and from work, job training, and related activities. "Almost 100 agencies partner with the foundation, including Talbert House, Freestore Foodbank, St. Vincent de Paul, Lighthouse Youth Services, and Cincinnati Works."
Hi-Tech Town
Boston transit riders have hi-tech ways to get real-time information and engage in public participation. The Massachusetts Bay Transportation Authority is texting real-time information to bus riders. Just the stop identification number and the telephone number are all that is needed. And if you have a smartphone, life is even better because Boston boasts more than 40 apps for transit. Helps having lots of smart, techie college students around. The MBTA is also considering service cuts and fare increases. Like the wired town that it is, Boston's residents are commenting publicly - on twitter. That meeting is so last century. Both stories via the TransitWire.
Tuesday, February 7, 2012
Transit Users - What Influences Use; Events and Local Stories
Events
Easter Seals Project ACTION
Forming Partnerships with Transit - Online course - Feb. 13-Mar. 26. Designed for transit advocates interested in increasing their role in the design and implementation of community transportation services, the course includes four learning modules: Transportation planning, funding, becoming a transit supporter, and strategies.
Partnership for Mobility Management
2012 Mobility Management Conference - May 9-10, 2012, Long Beach, CA. To be held in conjunction with the Bus and Paratransit Conference (details below), this conference features sessions on performance measurement, forming partnerships with different organizations, non-emergency medical transportation and brokerages, customer focus, information technology, and integration of facilities. The Partnership is a collaborative effort of seven national organizations and approximately 300 individual mobility managers and mobility management professionals from around the country.
Community Transportation Association of America
EXPO conference - May 20-25, 2012, Baltimore, Md. This year's EXPO will feature tracks on mobility management, connectivity and livability, transportation operations, and management, as well as separate tracks on transportation for dialysis, veterans and employment. There will also be a two-day Job Access Conference that will focus on transportation partners, namely economic development, workforce development, employers and chambers of commerce; and highlight the many transportation options for students, job seekers, employees and businesses.
American Public Transportation Association
2012 Legislative Conference - March 11-13, 2012, Washington, DC.
Bus & Paratransit Conference - May 6-9, 2012, Long Beach, CA.
Rail Conference - June 3-6, 2012,Dallas, TX
Public Transportation & Universities Conference - June 16-19, 2012, Fargo, ND. This conference explores the unique needs of university communities and the population they serve, including the issues of universal access and land use development.
American Public Works Association
Sustainability in Public Works Conference - June 25-27, 2012, Pittsburgh, PA.
Local Stories
Children’s Health Fund
Instead of traveling to the doctor, a CHF mobile medical clinic goes to children and families. This entertaining video shows what the mobile clinics do and what that means for families.
At the other end of the age spectrum, a travel training program for older people fosters independence. This article, Program takes aim at seniors' bus fears, about a Wisconsin mobility manager who does travel training, and the older people he is training, personalizes the significance of the training and the confidence, and the mobility that using public transportation provides for those with transportation and mobility challenges. The article appeared in the GazetteXtra.com.
Transit Riders by Mode
Minetta Transportation Institute
Understanding Transit Ridership Demand for a Multi-Destination, Multimodal Transit Network in an American Metropolitan Area - Lessons for Increasing Choice Ridership While Maintaining Transit Dependent Ridership explores ridership patterns in the Atlanta area, specifically what bus and rail commuters have in common and what transit variables separate them. Though the report looks at the Atlanta area, the findings seem useful for thinking about transit possibilities and realities in other areas of the country. Here are a few excerpts. Many more details can be found in the report.
TOD at Destination
Length of Wait Time Matters
Easter Seals Project ACTION
Forming Partnerships with Transit - Online course - Feb. 13-Mar. 26. Designed for transit advocates interested in increasing their role in the design and implementation of community transportation services, the course includes four learning modules: Transportation planning, funding, becoming a transit supporter, and strategies.
Partnership for Mobility Management
2012 Mobility Management Conference - May 9-10, 2012, Long Beach, CA. To be held in conjunction with the Bus and Paratransit Conference (details below), this conference features sessions on performance measurement, forming partnerships with different organizations, non-emergency medical transportation and brokerages, customer focus, information technology, and integration of facilities. The Partnership is a collaborative effort of seven national organizations and approximately 300 individual mobility managers and mobility management professionals from around the country.
Community Transportation Association of America
EXPO conference - May 20-25, 2012, Baltimore, Md. This year's EXPO will feature tracks on mobility management, connectivity and livability, transportation operations, and management, as well as separate tracks on transportation for dialysis, veterans and employment. There will also be a two-day Job Access Conference that will focus on transportation partners, namely economic development, workforce development, employers and chambers of commerce; and highlight the many transportation options for students, job seekers, employees and businesses.
American Public Transportation Association
2012 Legislative Conference - March 11-13, 2012, Washington, DC.
Bus & Paratransit Conference - May 6-9, 2012, Long Beach, CA.
Rail Conference - June 3-6, 2012,Dallas, TX
Public Transportation & Universities Conference - June 16-19, 2012, Fargo, ND. This conference explores the unique needs of university communities and the population they serve, including the issues of universal access and land use development.
American Public Works Association
Sustainability in Public Works Conference - June 25-27, 2012, Pittsburgh, PA.
Local Stories
Children’s Health Fund
Instead of traveling to the doctor, a CHF mobile medical clinic goes to children and families. This entertaining video shows what the mobile clinics do and what that means for families.
At the other end of the age spectrum, a travel training program for older people fosters independence. This article, Program takes aim at seniors' bus fears, about a Wisconsin mobility manager who does travel training, and the older people he is training, personalizes the significance of the training and the confidence, and the mobility that using public transportation provides for those with transportation and mobility challenges. The article appeared in the GazetteXtra.com.
Transit Riders by Mode
Minetta Transportation Institute
Understanding Transit Ridership Demand for a Multi-Destination, Multimodal Transit Network in an American Metropolitan Area - Lessons for Increasing Choice Ridership While Maintaining Transit Dependent Ridership explores ridership patterns in the Atlanta area, specifically what bus and rail commuters have in common and what transit variables separate them. Though the report looks at the Atlanta area, the findings seem useful for thinking about transit possibilities and realities in other areas of the country. Here are a few excerpts. Many more details can be found in the report.
Bus riders were overwhelmingly transit-dependent riders, and rail riders included a disproportionate number of choice riders. By and large, rail riders tend to come from zones with high levels of vehicle access and bus riders from zones with low levels of vehicle access. The model results highlight important similarities as well as differences between the two rider groups. In terms of similarities, both bus and rail trips are produced in larger numbers in zones with higher populations and higher population densities, and attracted to destinations with larger numbers of jobs, but generally not areas with the highest densities of employment. Both bus and rail riders are also generally quite sensitive to in-vehicle travel time and transfer time.
In terms of differences between bus and rail riders, bus riders tend to come from zones with lower income, lower vehicle access (as noted above), and higher minority populations. While rail riders also disproportionately come from minority zones, they come from zones with high levels of vehicle access and the income variable is not significant, except in the cases of rail riders destined to more dispersed destinations, who tend to come from zones with lower incomes, but also relatively high levels of vehicle access. Bus riders do not place the same importance on out-of-vehicle travel time to transit as do rail riders ... Rail riders, on the other hand, do place a premium on out-of-vehicle travel time ... This is not surprising given the small number of rail stations and their spatial distribution relative to the patterns of population and employment in Atlanta.
TOD at Destination
The results for the land-use variables also reveal important differences between bus and rail riders as well as insights into the importance of transit-oriented development (TOD). Bus riders in Atlanta are not influenced by the presence of a transit-oriented development at either the origin or destination. The CBD does not emerge as a statistically significant destination for bus riders; indeed, lower density employment clusters emerge as important destinations for these riders. For rail riders, on the other hand, the CBD does emerge as an important travel destination, and two of Atlanta’s TODs (Midtown and North Avenue) emerge as important contributors to rail patronage, in excess of what would otherwise be predicted by the employment levels or densities of these zones.
...
Length of Wait Time Matters
The variable that had the greatest effect in determining transit ridership was the transit travel time between the origin zone and the destination zone. [T]ransit-dependent ridership, rather than being a fixed amount regardless of service quality, increases tremendously if the transit travel time between origin and destination is reduced.
...
What we see by looking at the parameters is a model that depicts more affluent, auto- owning riders using transit than does the bus model. The rail riders are willing to use rail transit to get to jobs throughout the region (not just jobs in the CBD), so long as they can walk to jobs once they get off the trains or can easily transfer to frequent buses that do not take long to reach jobs in the vicinity. CBD and TOD at the rail destination (though not at the rail origin) are highly important to potential rail riders.
...
In-vehicle travel time is relatively less important than out-of-vehicle travel time because trains are relatively fast, and their travel time is not an issue to passengers, in contrast to the depressing effect of slow buses, as shown earlier in the bus models. What really matters, however, are lengthy waits when transferring between trains and buses ... This conclusion is reinforced when we look at the tremendous impact that destination TODs have on multiplying rail ridership in comparison to the insignificant impact that origin TODs have on ridership. Where destination TODs exist, walking to the final destination is relatively short and attractive, and rail ridership to the TOD increases by 500% over what the model otherwise would predict for that zone.
Tuesday, January 31, 2012
Transit + Technology = Algorithm of Multiple Possibilities
If you are perturbed that the $230 transit benefit was not extended (the monthly benefit went back to $125 and the New York Times opinion page is not happy either), here are tools for transit and transit boosters.
According to 'I Hate the Blue Line' and Other Things Transit Systems Can Learn From Twitter, an article that appeared on the Atlantic's Cities page, transit systems should employ the free customer service data that twitter provides. What are the riders praising or complaining about? The answers are easier to find on twitter than via conventional tools, such as carefully-worded customer surveys, the author argues. I would agree that is the case in places where ridership is well connected - to apps and smartphones.
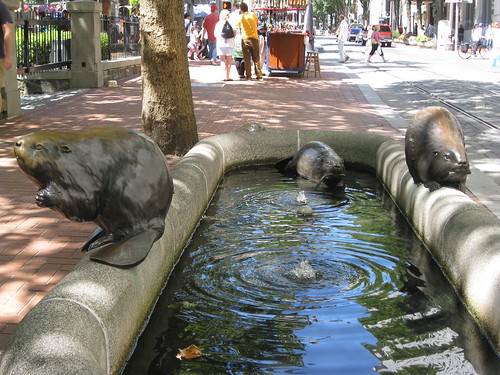
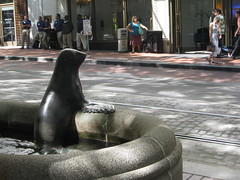
 [Cute animal sculptures in Portland.]
What do people want in terms of public transportation? View this video from Kansas City. Lots of transit love and energy even from people accustomed to using their cars.
Penguins: Better than Mad Men?
And if you have 30 seconds of work time to waste, I mean be productive, view a transit ad from Belgium. Cute, has penguins; need I say more?
American Public Transportation Association
APTA's public transit ridership numbers are out and the numbers are up. What is causing the momentum in favor of transit? Thrift, environmental consciousness, quality improvements, free wifi, desire for a vacation from doing traffic battle before and after work?


Can Technology Boost Ridership?
The answer is yes if the technology provides real-time information regionally. The Daily Iowan reports that ridership is up five percent in the one month since real-time information monitors were installed around the University of Iowa's campus - even in dorms. The article, Officials: Bus monitors help to increase ridership, goes into more detail, but implies that the transit system is the same otherwise, so that the jump in business is attributable to the one significant change. Thank you to the TransitWire for the link.
Interesting blog post from Planetizen about mapping health, commuting, income and educational patterns across the United States.
According to 'I Hate the Blue Line' and Other Things Transit Systems Can Learn From Twitter, an article that appeared on the Atlantic's Cities page, transit systems should employ the free customer service data that twitter provides. What are the riders praising or complaining about? The answers are easier to find on twitter than via conventional tools, such as carefully-worded customer surveys, the author argues. I would agree that is the case in places where ridership is well connected - to apps and smartphones.
What do people want in terms of public transportation? View this video from Kansas City. Lots of transit love and energy even from people accustomed to using their cars.
Penguins: Better than Mad Men?
And if you have 30 seconds of work time to waste, I mean be productive, view a transit ad from Belgium. Cute, has penguins; need I say more?
American Public Transportation Association
APTA's public transit ridership numbers are out and the numbers are up. What is causing the momentum in favor of transit? Thrift, environmental consciousness, quality improvements, free wifi, desire for a vacation from doing traffic battle before and after work?
This is a 2.0 percent increase over the same quarter last year, representing an increase of nearly 52 million trips. Ridership in all public transportation modes increased, led by light rail which increased by 5.8 percent.The full ridership report is available. I usually read the whole thing, but this time I relied on the summary. If you have an extra 10 minutes or so, there are always thought-provoking details in the report as well as interesting statistics by mode and locations. APTA also posted an explanation about the transit benefit reduction and the increase in the parking benefit.
This is also the first time in three years that ridership has increased for all three quarters. The ridership increase is attributed to a number of factors including high gas prices, improved real time passenger information, and a recovering economy.

Can Technology Boost Ridership?
The answer is yes if the technology provides real-time information regionally. The Daily Iowan reports that ridership is up five percent in the one month since real-time information monitors were installed around the University of Iowa's campus - even in dorms. The article, Officials: Bus monitors help to increase ridership, goes into more detail, but implies that the transit system is the same otherwise, so that the jump in business is attributable to the one significant change. Thank you to the TransitWire for the link.
Interesting blog post from Planetizen about mapping health, commuting, income and educational patterns across the United States.
Wednesday, January 25, 2012
Apps for Local Trips and Long-Distance Travel Options
Department of Transportation
None other than Secretary of Transportation Ray Lahood is getting on the smartphone apps bandwagon. The apps are providing transit riders in many places with real-time information. But not enough places, according to the Secretary.
Amalgamated Transit Union
ATU is featuring on its homepage links to articles with depressing news for transit workers and for public transportation - attacks against bus drivers and transit equipment.
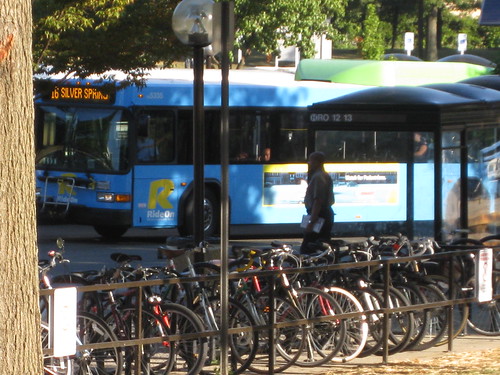
 [Buses and bikes at the Takoma Metro station, which serves the Washington,DC/Maryland border community.]
American Association of State Highway and Transportation Officials
AASHTO's President is praising rail performance around the country. Systems in Virginia and Michigan, as examples, have recently delivered service to double the riders they had a few years ago. "Ridership on Amtrak's many long-distance lines are at all-time highs, ... From October 2010 to September 2011, more than 30 million trips were recorded on America's intercity passenger rail lines." More from AASHTO President John Horseley's post about rail in the AASHTO Journal.
American Bus Association
The ABA presents an update to its advocacy for the past few years that Congress should save money and fund essential bus service to rural residents far from airports. In a report issued in the fall, Keeping Rural Communities Connected: Comparison of EAS Program To Coach Bus Service, ABA "compares the cost and environmental impact of current subsidized air service provided to rural communities under the Essential Air Service (EAS) program, to an alternative method of connecting these rural communities to the nationwide air transport system." Costs for bus transportation would be almost 70 percent cheaper than EAS currently funded. However, travelers would spend more time en route were bus service to replace EAS, though two-thirds would only need an hour or less of extra time to reach their destinations.
According to ABA's data:
 [California landscape from Amtrak's Coast Starlight train.]
None other than Secretary of Transportation Ray Lahood is getting on the smartphone apps bandwagon. The apps are providing transit riders in many places with real-time information. But not enough places, according to the Secretary.
In fact, a review of 276 transit agency systems revealed that only 45 of them provide some information on mobile devices. And of those 45 agencies, only 15 offered their riders the real-time information precise planning requires.For more information, visit the Fastlane.
We think we can do better for our nation's transit riders. So last week, Deputy Secretary John Porcari and U.S. Chief Technology Officer Aneesh Chopra gathered a variety of stakeholders to see what we can do to help millions more transit riders get better access to information.
Some transit agencies want to share this information with their customers, but lack the resources. So one of the challenges for the folks around the table was to find a way to reduce the cost of providing the data in a format that can make riders' lives easier.
Amalgamated Transit Union
ATU is featuring on its homepage links to articles with depressing news for transit workers and for public transportation - attacks against bus drivers and transit equipment.
American Association of State Highway and Transportation Officials
AASHTO's President is praising rail performance around the country. Systems in Virginia and Michigan, as examples, have recently delivered service to double the riders they had a few years ago. "Ridership on Amtrak's many long-distance lines are at all-time highs, ... From October 2010 to September 2011, more than 30 million trips were recorded on America's intercity passenger rail lines." More from AASHTO President John Horseley's post about rail in the AASHTO Journal.
American Bus Association
The ABA presents an update to its advocacy for the past few years that Congress should save money and fund essential bus service to rural residents far from airports. In a report issued in the fall, Keeping Rural Communities Connected: Comparison of EAS Program To Coach Bus Service, ABA "compares the cost and environmental impact of current subsidized air service provided to rural communities under the Essential Air Service (EAS) program, to an alternative method of connecting these rural communities to the nationwide air transport system." Costs for bus transportation would be almost 70 percent cheaper than EAS currently funded. However, travelers would spend more time en route were bus service to replace EAS, though two-thirds would only need an hour or less of extra time to reach their destinations.
According to ABA's data:
The use of scheduled coach bus service instead of air service would also reduce annual fuel use by 5.7 million gallons, would reduce annual CO2 emissions by over 63,000 tons, and would reduce annual emissions of NOx, HC, CO, and SO2 by 13.2 tons, 1,186 tons, 2,066 tons, and 27.8 tons respectively.ABA also makes the case that buses could operate profitably on most of these routes, after initial expenses, whereas EAS is heavily subsidized. The report includes details about the methodology and assumptions that produced its conclusions.

Monday, January 23, 2012
Transportation Camp
A camp that does not require or supply duffel bags, trunks, bunks, tents, swim instruction, or counselors, Transportation Camp is an unconference - no pre-planned sessions or experts - with transit, alternative mode, planner and data, self-described geeks gathering for a day of exchanging ideas and learning.
I met friends from the worlds of transit technical assistance, mobility management, and the Federal Transit Administration (FTA). I also ran into people whom I had not met before, but have been in contact with through twitter and blogs. Two surprises were meeting TransitWire (Susan Bregman, who started the blog/twitter service as a Transit Cooperative Research Program (TCRP) project) (I felt like I was meeting a transit celebrity) and someone from Austria who knows all about mobility management in the European Union and pointed me to performance measures developed in Sweden. There were even a couple of people from my neighborhood who are involved in local transit and alternative mode issues.
 [Multi-modal in Denver at the under-construction hub at Union Station.]
Designing Your Own Unconference
Because there were so many sessions, maybe 10 at a time, everyone's experience was different. I attended a mix of sessions on topics I know something about and others about which I acknowledge total ignorance. So, on the ignorant side, I went to a demonstration of an open trip planner that provides route information for walkers, bikers, wheelchair users and transit riders. Incredibly impressive, especially for bikers because the program allows for input of preferences, but not on a real-time level. For example, for wheelchair users, the program has data about accessible streets and transit entrances and exits, but it does not collect or transmit data that an elevator just went out of service at a particular station. I do not doubt, however, that the techie folks will get there.
I also went to Greening the Suburbs, which connected two DC-exurban planners from far outside different circumference points on the Beltway, to discuss common issues of residents who drove til they qualified for a mortgage and others who want a country-like lifestyle. The question is not preference as the idea of green is popular (where would we be without Kermit?), but how to make green convenient, particularly in relation to travel habits, as that is a prime consideration of people with long commutes and no infrastructure to walk or bike to a convenience or grocery store even if it is only a few blocks away. Arlington's decades-long effort to be a green city/suburb and Houston's decentralized employment nodes were examples discussed. A Houston native said that high energy prices would soon green the suburbs whatever the preferences of their residents, while another decried the huge expenditures to support the expense and costs of the auto-centric lifestyle.
 [A Portland tech-savvy bus stop with wait times, seating and protection from precipitation.]
I also went to a session in which a rural Virginia transit employee asked for ideas about promoting and improving transit, particularly for young professionals. Though, like many sessions, conversation veered off course at times, he walked away with suggestions about how to engage transit leadership, market transit and make low-cost improvements that will attract riders.
For a wonderful synopsis of the energy and connections made at Transportation Camp, read today's TransitWire.
I met friends from the worlds of transit technical assistance, mobility management, and the Federal Transit Administration (FTA). I also ran into people whom I had not met before, but have been in contact with through twitter and blogs. Two surprises were meeting TransitWire (Susan Bregman, who started the blog/twitter service as a Transit Cooperative Research Program (TCRP) project) (I felt like I was meeting a transit celebrity) and someone from Austria who knows all about mobility management in the European Union and pointed me to performance measures developed in Sweden. There were even a couple of people from my neighborhood who are involved in local transit and alternative mode issues.
Designing Your Own Unconference
Because there were so many sessions, maybe 10 at a time, everyone's experience was different. I attended a mix of sessions on topics I know something about and others about which I acknowledge total ignorance. So, on the ignorant side, I went to a demonstration of an open trip planner that provides route information for walkers, bikers, wheelchair users and transit riders. Incredibly impressive, especially for bikers because the program allows for input of preferences, but not on a real-time level. For example, for wheelchair users, the program has data about accessible streets and transit entrances and exits, but it does not collect or transmit data that an elevator just went out of service at a particular station. I do not doubt, however, that the techie folks will get there.
I also went to Greening the Suburbs, which connected two DC-exurban planners from far outside different circumference points on the Beltway, to discuss common issues of residents who drove til they qualified for a mortgage and others who want a country-like lifestyle. The question is not preference as the idea of green is popular (where would we be without Kermit?), but how to make green convenient, particularly in relation to travel habits, as that is a prime consideration of people with long commutes and no infrastructure to walk or bike to a convenience or grocery store even if it is only a few blocks away. Arlington's decades-long effort to be a green city/suburb and Houston's decentralized employment nodes were examples discussed. A Houston native said that high energy prices would soon green the suburbs whatever the preferences of their residents, while another decried the huge expenditures to support the expense and costs of the auto-centric lifestyle.

I also went to a session in which a rural Virginia transit employee asked for ideas about promoting and improving transit, particularly for young professionals. Though, like many sessions, conversation veered off course at times, he walked away with suggestions about how to engage transit leadership, market transit and make low-cost improvements that will attract riders.
For a wonderful synopsis of the energy and connections made at Transportation Camp, read today's TransitWire.
Tuesday, January 17, 2012
AARP Informs Reauthorization Conversation with Equity Considerations
AARP
Expecting transportation reauthorization to happen, AARP in Transportation Funding Reform: Equity Considerations for Older Americans "examines whether current or proposed transportation funding sources at all three levels of government are in some way inequitable for low-income people, rural residents, people with disabilities, or older adults."
AARP is analyzing this issue now because revenues from the gas tax are decreasing and are increasingly inadequate to pay for our transportation infrastructure needs.
Gas Tax Most Popular Road Fee
While the current gas tax is equitable in that users pay the fees, the current gas tax is described as regressive - disproportionately costing low-income users - and further distributing costs unevenly in that it is a relative bargain for those who own fuel-inefficient vehicles and it does not charge for peak-time usage of the roads. The report also looks at alternatives to the traditional gas tax that have been popping up at the state and local levels. These include tolling and mileage fees.
The report notes that the current federal gas tax only takes into account use, but not impacts.
Sales and Other Taxes Unrelated to Driving
Though income taxes are the most progressive, they do not account for impact. Property and development-related infrastructure taxes are relatively regressive, while sales taxes are completely regressive.
In terms of older Americans, the AARP report observes that they are more likely than the general population to live in rural areas (20 percent of rural residents are over 65) and more likely to live in suburban areas of metropolitan areas. The report's interpretation of the numbers is that 70 percent of older Americans live in "low-density places, where, for example, regular fixed-route public transit use may not be a practical option." Their travel patterns indicate that older people travel more during mid-day than those 16 to 64 and less during rush hours. Their cars are older; they travel less on highways and they do not drive for much of their miles traveled.
Expecting transportation reauthorization to happen, AARP in Transportation Funding Reform: Equity Considerations for Older Americans "examines whether current or proposed transportation funding sources at all three levels of government are in some way inequitable for low-income people, rural residents, people with disabilities, or older adults."
AARP is analyzing this issue now because revenues from the gas tax are decreasing and are increasingly inadequate to pay for our transportation infrastructure needs.
Gas Tax Most Popular Road Fee
While the current gas tax is equitable in that users pay the fees, the current gas tax is described as regressive - disproportionately costing low-income users - and further distributing costs unevenly in that it is a relative bargain for those who own fuel-inefficient vehicles and it does not charge for peak-time usage of the roads. The report also looks at alternatives to the traditional gas tax that have been popping up at the state and local levels. These include tolling and mileage fees.
The report notes that the current federal gas tax only takes into account use, but not impacts.
Many analysts think it is only fair for travelers to pay a fee that takes into account the negative impacts their travel has on the highway itself (through the weight of their vehicle, for example) and the time and health costs they impose on other travelers (when they travel in the peak period or drive polluting vehicles). Without this link, drivers partially escape the financial, pollution, and health costs they impose on others and create excess demand for new highway capacity. Drivers who act to conserve gas end up subsidizing those who do not. For example, off-peak users subsidize peak-period users. Some highway advocates note that paying for public transportation (and underground storage tanks) from the HTF [Highway Trust Fund] breaks the link between those who pay and those who benefit. The transit advocates’ response to this argument is that payments into the Mass Transit Account help offset drivers’ pollution and congestion costs.Three quarters of states charge a gas tax in addition to the federal tax. States also charge user fees for car ownership, licensing, and tolls. In terms of new types of taxes, the report analyzes the equity ramifications of fees based on vehicle miles traveled (VMT) and high-occupancy lane usage (which it finds relatively non-regressive because they are not usually located in areas where people with low incomes travel in great numbers). Not mentioned are public transit fare rates.
Sales and Other Taxes Unrelated to Driving
Though income taxes are the most progressive, they do not account for impact. Property and development-related infrastructure taxes are relatively regressive, while sales taxes are completely regressive.
The improvements funded by a retail sales tax, for example, while failing to link payment to transportation system use, may provide benefits even to people who infrequently travel by car or public transportation. Living in a community with uncongested roads, a good transportation system, or a safe cycling network may have intrinsic value.The report calls for equity in terms of mobility availability for all.
Increased investment in public and community-based transportation options, highway modifications, driver assessment and training, pedestrian facilities, and attention to urban design and land use policies would help to ensure that those who pay receive their fair share of benefits.Fairness for Older Americans
In terms of older Americans, the AARP report observes that they are more likely than the general population to live in rural areas (20 percent of rural residents are over 65) and more likely to live in suburban areas of metropolitan areas. The report's interpretation of the numbers is that 70 percent of older Americans live in "low-density places, where, for example, regular fixed-route public transit use may not be a practical option." Their travel patterns indicate that older people travel more during mid-day than those 16 to 64 and less during rush hours. Their cars are older; they travel less on highways and they do not drive for much of their miles traveled.
Subscribe to:
Comments (Atom)